PWM Generation Code
When working (ok, avoiding working) on my thesis, I realized I needed to generate some pulse width modulation graphs. For those who don't know, it's a way of taking a low-frequency, high-resolution signal and converting it to a high-frequency, low-resolution signal. This technique is very popular in analog design, especially audio amplifiers, where you can easily get enormous over-sampling ratios due to the low signal bandwidth. Just making the one-bit graph is pretty easy, but it took me a bit to think of a good way of making the multi-bit ones, especially in a dynamic way (read: not 100 if x > y statements). Throwing it here for now, hoping to come back and comment/explain the tuning knobs at the top a bit better once my thesis is done.
import numpy as np
import matplotlib.pyplot as plt

StepsPerCycle = 30 # PWM resolution
NumCycles = 30 # number of PWM cycles in the signal
NumPoints = StepsPerCycle * NumCycles
NumThresholds = 3 # number of PWM trigger thresholds

thresholds = np.arange(0, 1, step=1/NumThresholds)

time = np.linspace(0, 1, num=NumPoints)
vsin = 0.5*np.sin(2*np.pi*time) + 0.5
vout = np.copy(vsin)

for n in range(NumCycles):
    error = vsin[StepsPerCycle * n] - thresholds

    thresh = np.argmin(error[error >= 0])
    high = int(np.floor(error[thresh] * StepsPerCycle))

    vout[n*StepsPerCycle : n*StepsPerCycle + high] = (thresh+1)/NumThresholds
    vout[n*StepsPerCycle + high : (n+1)*StepsPerCycle] = thresh/NumThresholds

plt.close('all')
plt.plot(time, vout)
plt.plot(time, vsin)
plt.show()
Some quick output examples:
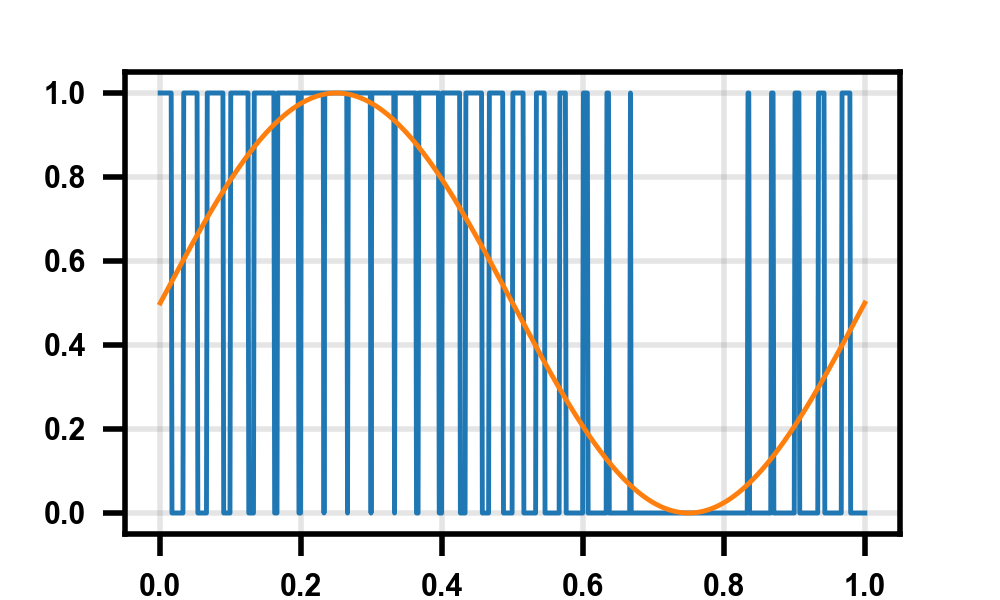
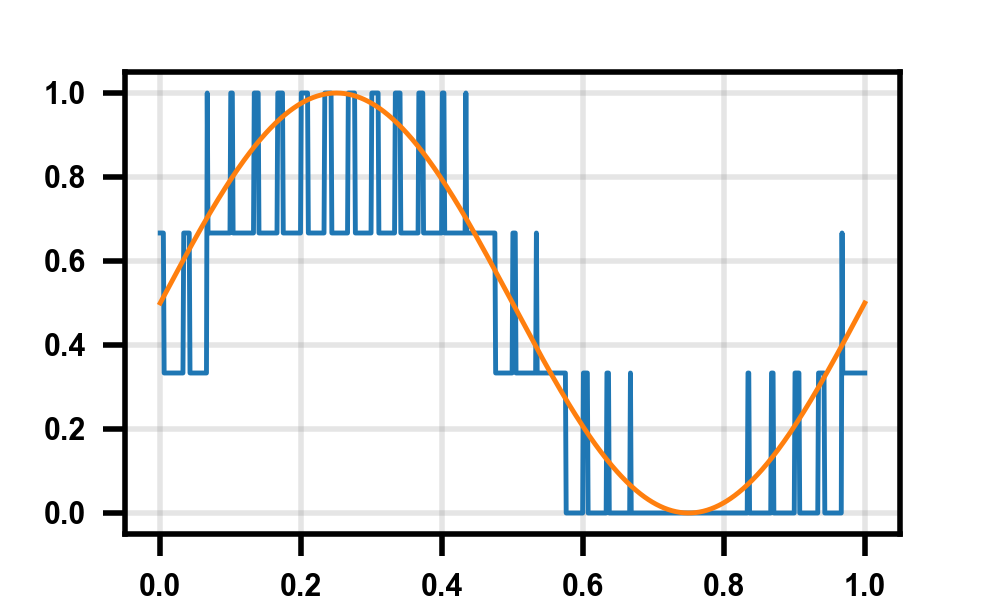
Hope this is useful to someone else!