Fourier Series + Transform
To understand where the more advanced topics in circuits lie, we need to learn a little more math. I'm going to do my best to keep it fairly light on the actual proof or analysis though, and just keep it to pretty pictures so you have a gut instinct of what these terms mean. The biggest concept is understanding the Frequency Domain compared to the Time Domain. The time domain is simple, we live in it.
Time goes one way, and for better or worse, that's forward. When we look at a plot of a sine wave below, we describe it's amplitude (height) as a function of time. We can say it has a height of 1 at one second, and maybe a height of 1/4 another second later. The only problem is, we can never really draw a real sine wave. A true sine wave is infinite, and my plotting software crashed when I told it to draw an infinite sine wave (not that your browser would probably be able to render it either)! So we always draw truncated versions with just a couple periods.
The frequency domain is slightly different. While it too goes to infinity, we can think of waves, and all periodic signals, as a function of frequency rather than time. Rather than start with something weird like sine, we can start with something simple like a clock. A clock “ticks” every second. In the time domain, we can visualize this as a little impulse shooting up once a second, and then immediately shooting back down. But we can also think of it slightly differently, as these ticks happen once PER second. We define our frequency unit to be Hertz - which is the inverse of a second. That's nothing new, we can already think of a few things like this. Minutes are slow in Hertz - they tick every 1/60 Hertz, very small. If you walk fast, you can probably go 4 or 5 feet-Hertz, which would describe how far you walk in a second. Seconds, of course, are 1 Hertz, as the inverse of one is one!
Now the problem is what if it's not clear what translate to what in these domains? With an ugly block of frequencies or perhaps a confusing time signal, going from one to the other is often quite using. We'll do that through a technique called Fourier Decomposition, which utilizes the Fourier Series to try and understand a method visualizing our signals. Fourier was a famous mathematician who realized that any periodic signal could be broken down into a sum of sine and cosine waves. If you've taken a calculus class, this is analogous to Taylor series and polynomials. The formula's are fairly dense and can be viewed elsewhere, so let's get down to those visual guides. Let's start with some sine waves and move them to square waves, all in the time domain, and see what that does in the frequency domain.
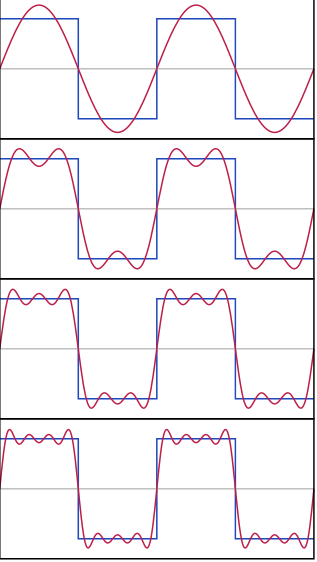
Here we make a block-y square wave from a bunch of curvy sine waves. Skipping the exact formula, we can show if we do this forever, we can make it line up exactly. For now, we'll settle for a few sine waves and a decent approximation. The thing is, we know how to turn sine waves from time to frequency domain - they're just simple pulses. We're lucky that the Fourier Transform has a neat property - it's linear. We can take the transform of a sum, or the sum of a transform, and we'll get the same end result. So if we individually transform each sine wave into a pulse, then sum those pulses, we'll get our frequency domain transform of the square wave! This is shown below.
Pretty mind blowing, in my opinion. Definitely one of those gif's that just makes me go “whoa”, so if you are feeling that, you're not alone! P.S. All images from Wikipedia this time.